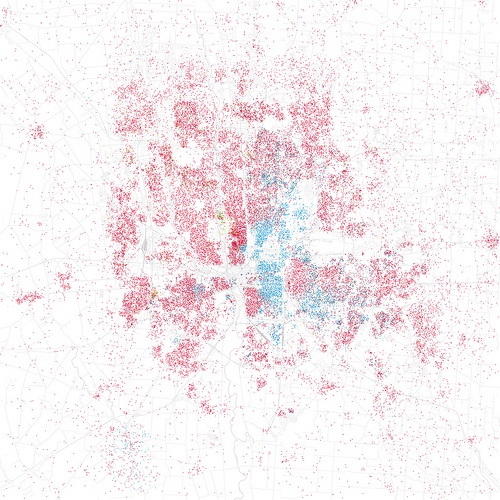
Map showing the Racial Breakdown of Columbus, Ohio

Columbus, Ohio: Green represents Asian, Red represents Caucasian, Orange is Hispanic, Blue is Black, Grey is Other–One dot represents 25 people
Using information from the latest U.S. Census, Digital Cartographer Eric Fischer, then color coded them based upon race, the maps represent the extent that America has blended together in the nations 40 largest cities.
More here from Sancte Pater
Related Post: Maps show Racial Breakdown of Americas Largest Cities–Mail Online, UK